Premise
When managing a virtualized environment like Proxmox, it can be helpful to use a monitoring tool to keep an eye on what's going on. Recently, I decided to integrate Grafana into my setup which now provides me with real-time metrics for system performance, health, and in the future, whatever else I need to monitor.
What is Grafana?
Grafana is a platform that can be used to monitor and visualize various data sources including Proxmox, via InfluxDB. It provides a user friendly interface and an extensive library of plugins and dashboards with a large user community.
What is InfluxDB?
InfluxDB is a time-series database designed to handle high read and write queries, making it perfect for storing and analyzing time-stamped data such as metrics and events.
Creating LXCs
Let's get started! If you would like to use this article as a tutorial, you should be able to follow along, assuming you already have a proxmox instance set up.
I am using Helper-Scripts to simplify the process of creating VMs and LXCs. You can create a standard linux vm, like an Ubuntu VM with docker installed, but Helper-Scripts takes care of most of the installation work we have.
We need to create 2 LXCs: one for Grafana, and another for InfluxDB. Entering the Proxmox shell for any node, enter these commands:
bash -c "$(wget -qLO - https://github.com/tteck/Proxmox/raw/main/ct/grafana.sh)"
bash -c "$(wget -qLO - https://github.com/tteck/Proxmox/raw/main/ct/influxdb.sh)"
I used the default settings and version 2 for InfluxDB. The wizard is easy to use.
Configuring InfluxDB
After the installation finishes, visit the InfluxDB URL in your browser. If this wasn't provided to you, it is usually located at port 8096 of the LXC. Then, follow the guide to set up.
Steps:
- Log in with default credentials: Username -
admin, Password -admin - Create a bucket in an organization. For simplicity, I used Proxmox for both.
- Generate an API token with all access and save it for later.
Setting up Proxmox
Proxmox needs to send data to InfluxDB, which Grafana will then read from.
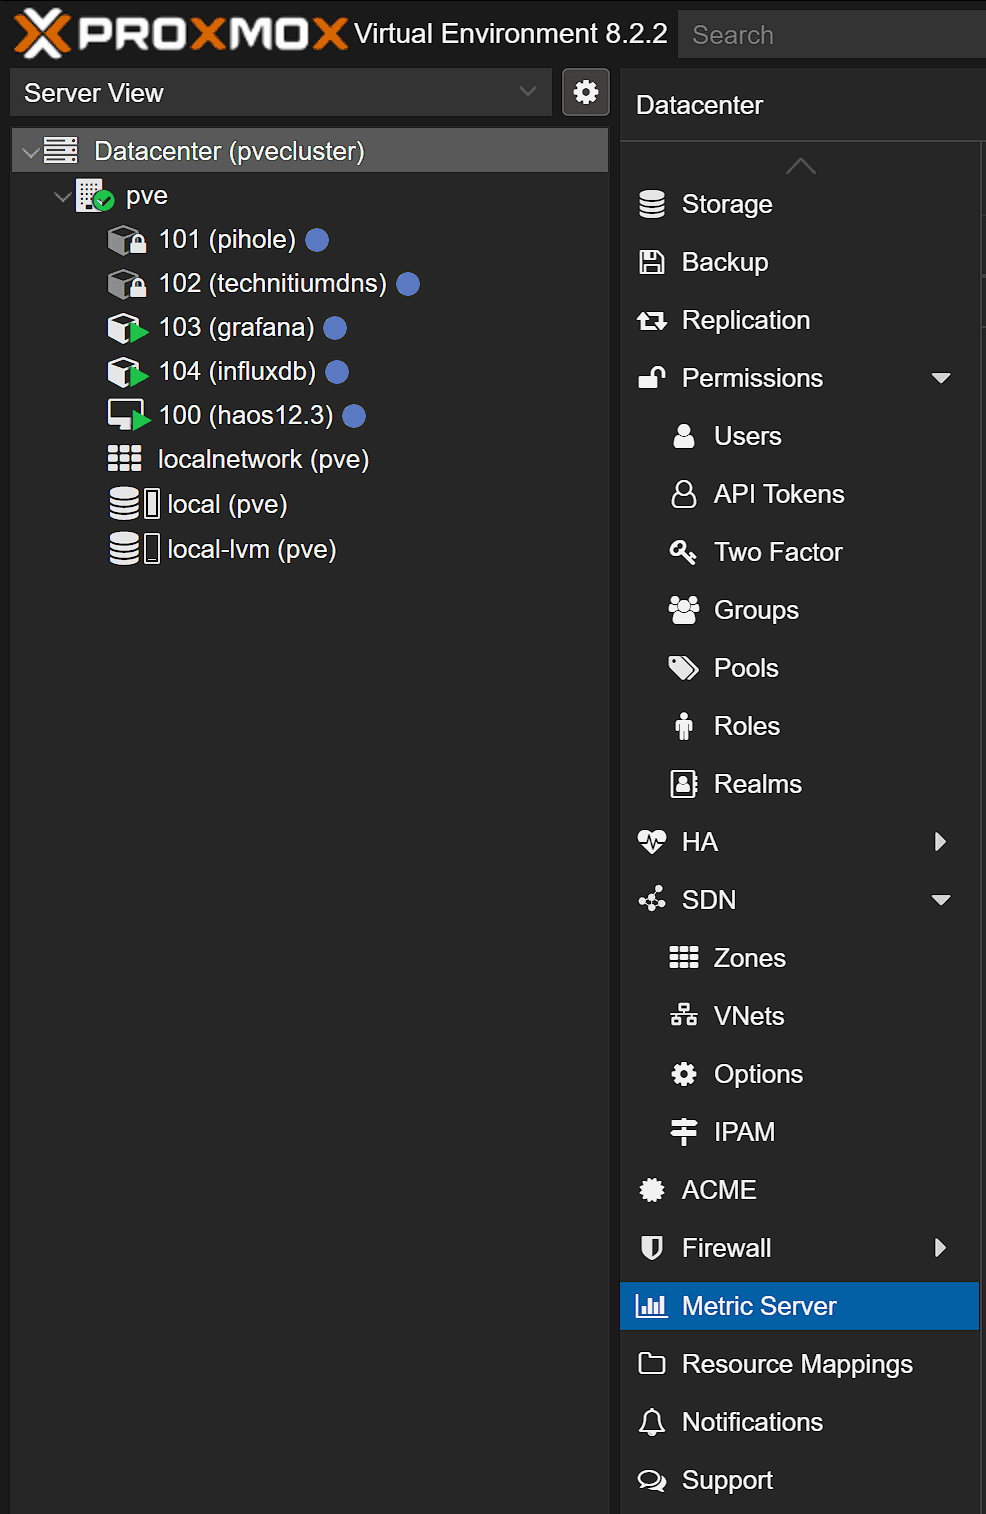
Create a new entry in the metric server page of Proxmox's web interface. Fill the labels with your credentials and switch UDP to HTTP. Make sure to fill in the Organization and Bucket fields (I got stuck on this for around 15 minutes).

Data Explorer
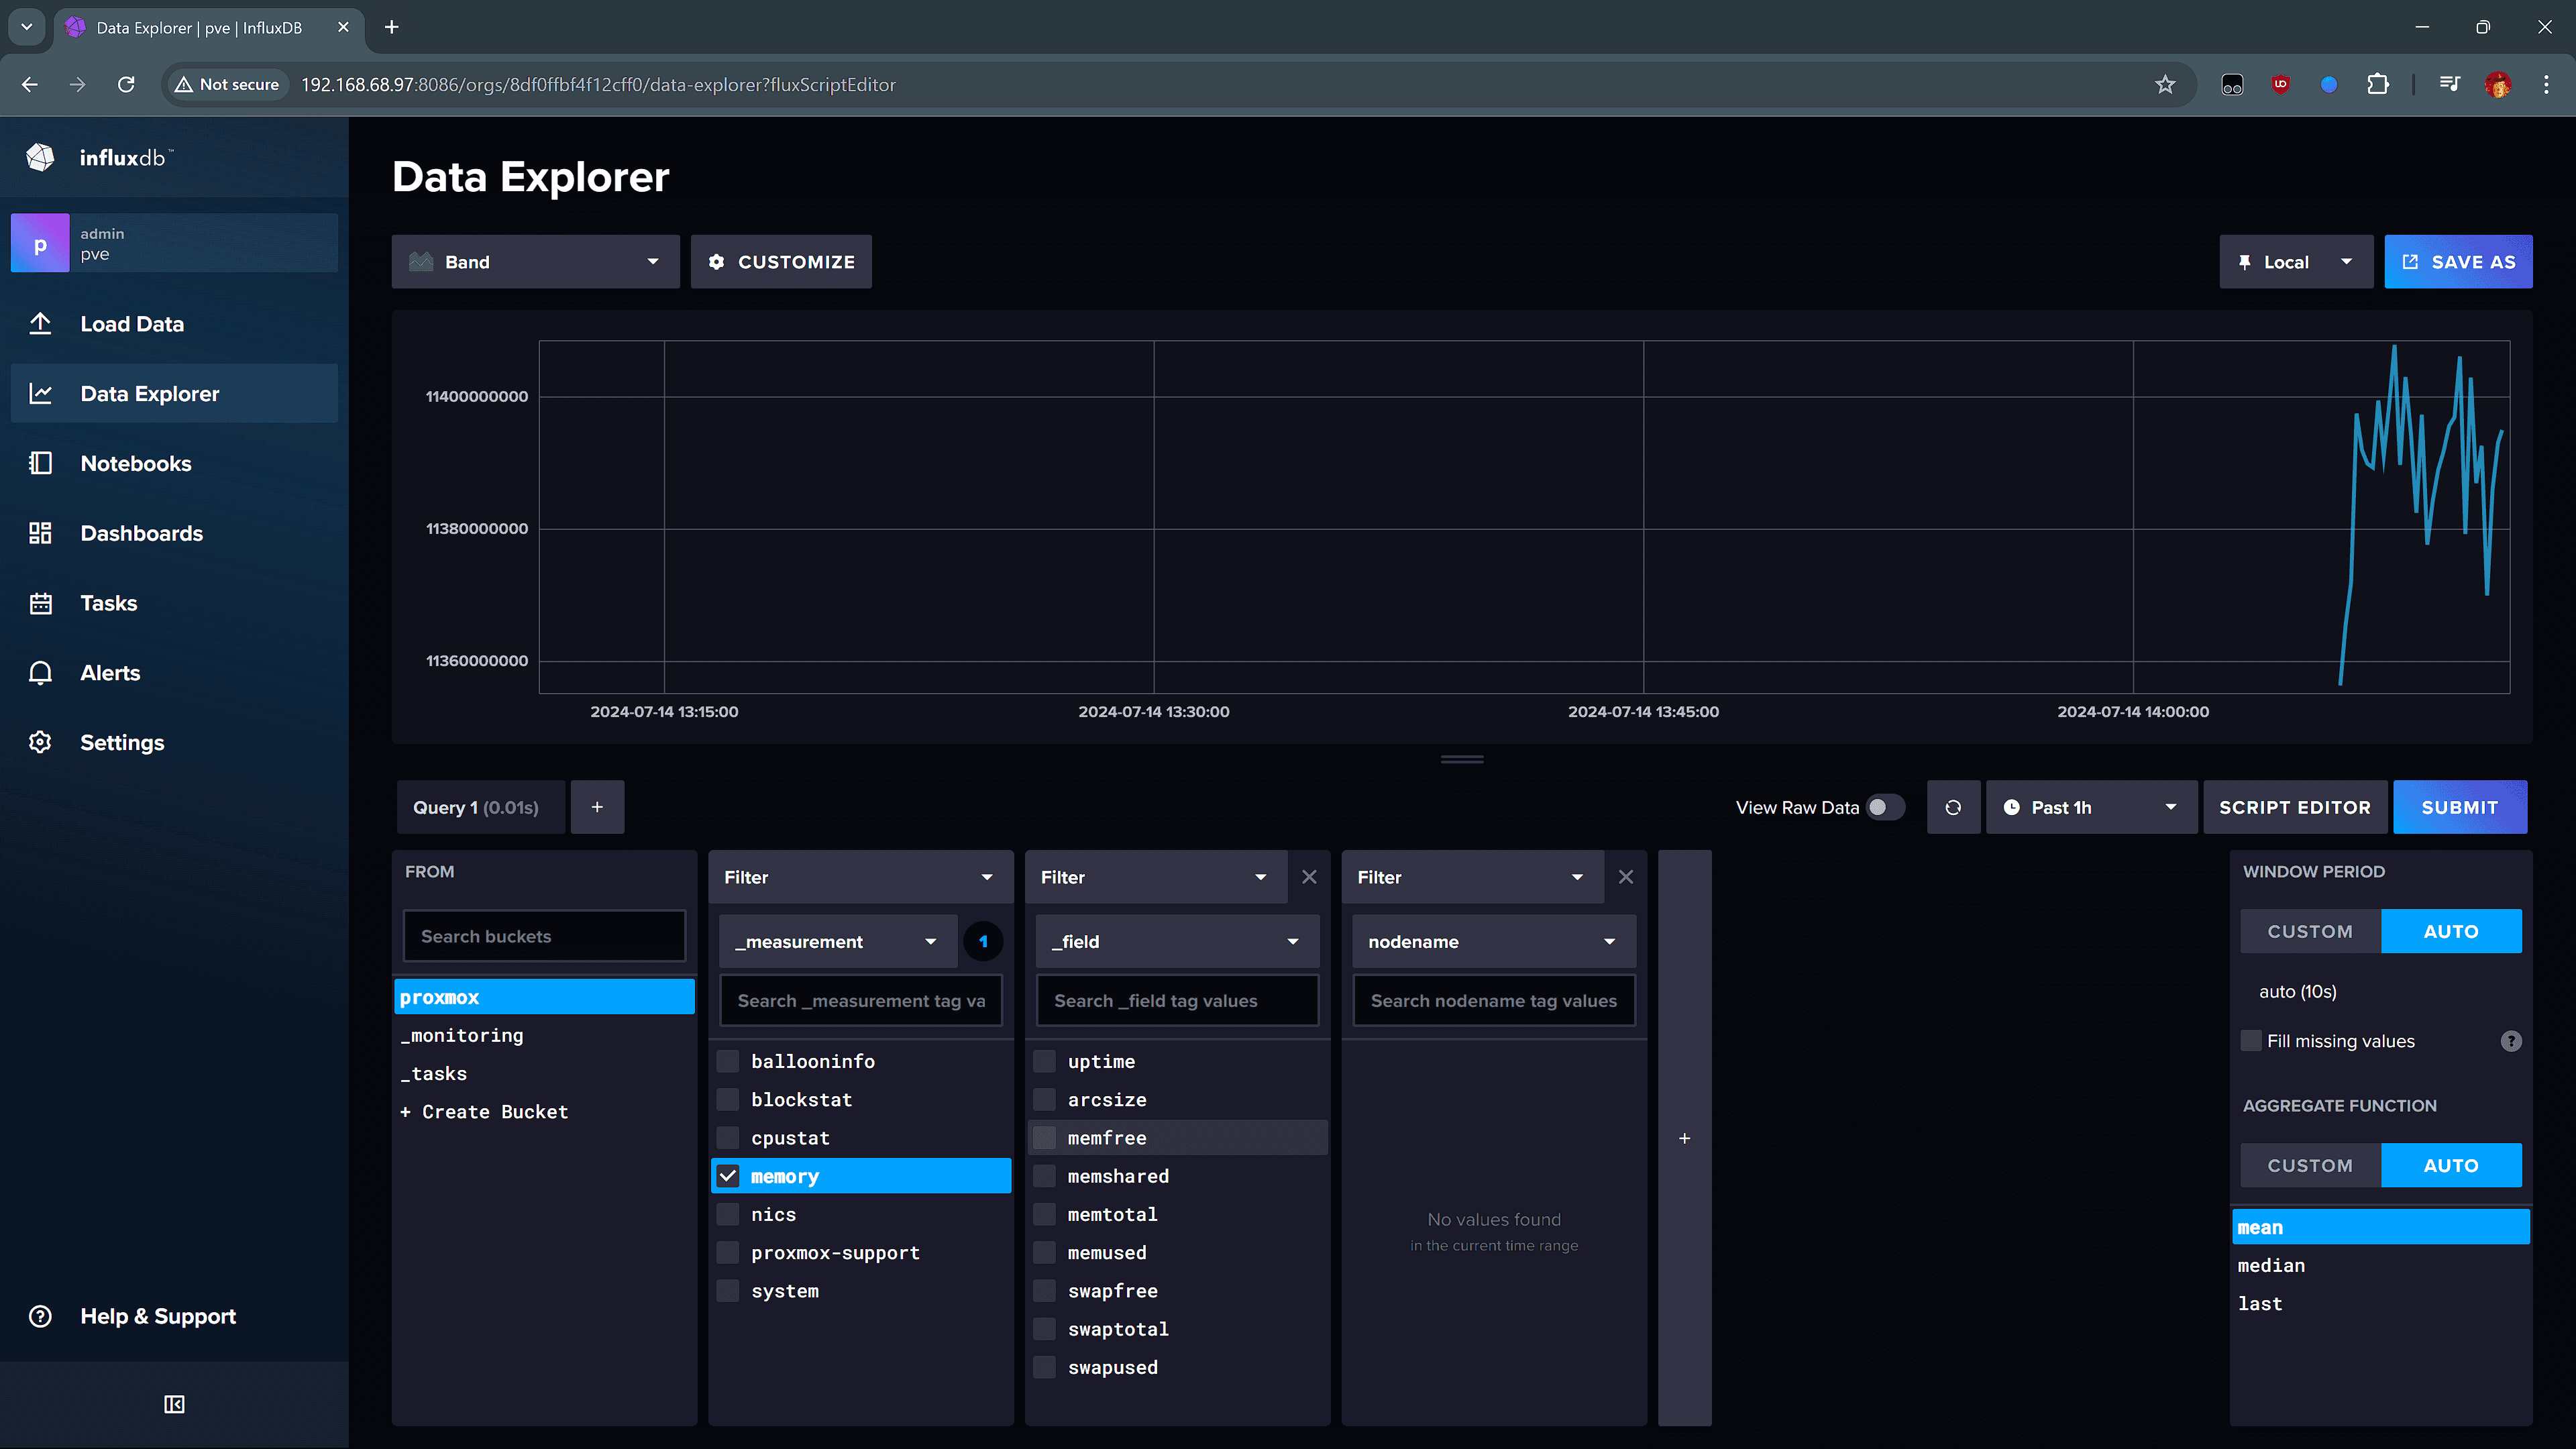
Proxmox sends data every 10 seconds by default. You should soon be able to see Proxmox data within InfluxDB, in the data explorer.

Grafana Dashboard
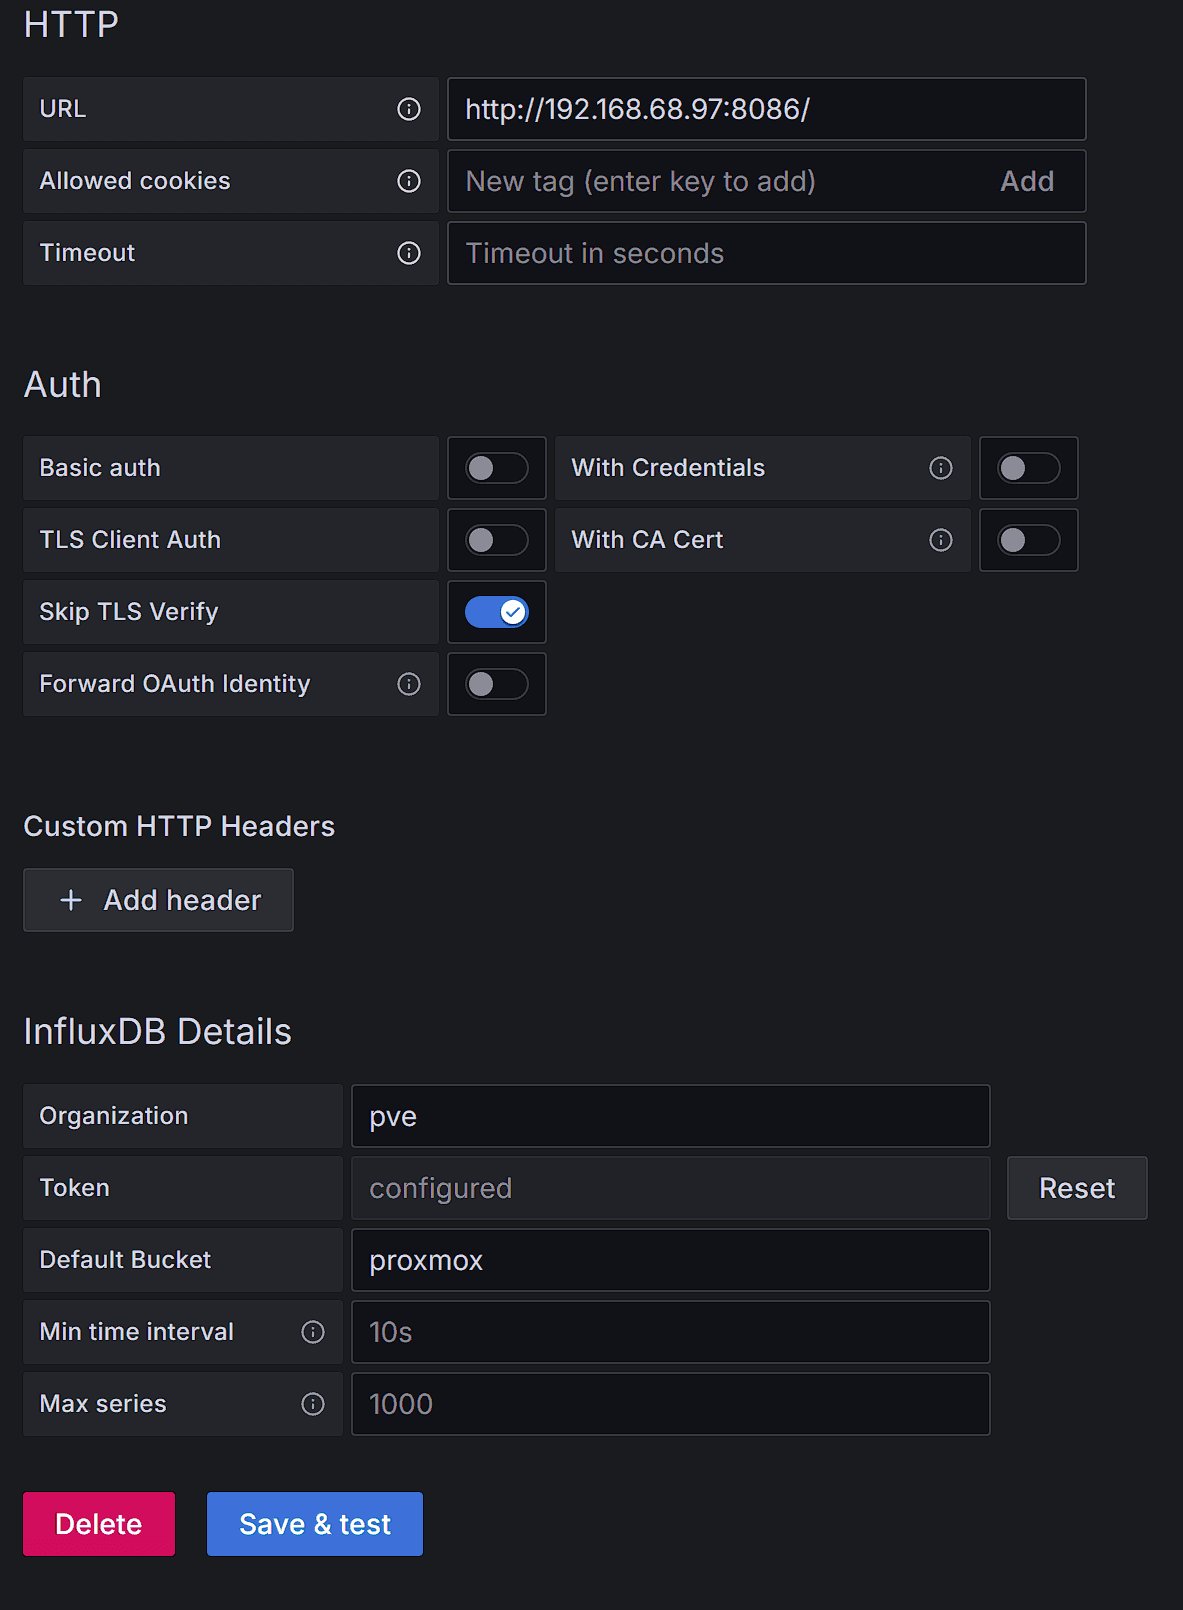
Finally, configure a new Data Source in Grafana.

You should then be able to use the data and start creating a dashboard. I suggest creating your own because you can make something that is perfect for you, but if you want, you can use a public dashboard. Just search for Grafana Dashboards for Grafana.
Final Product
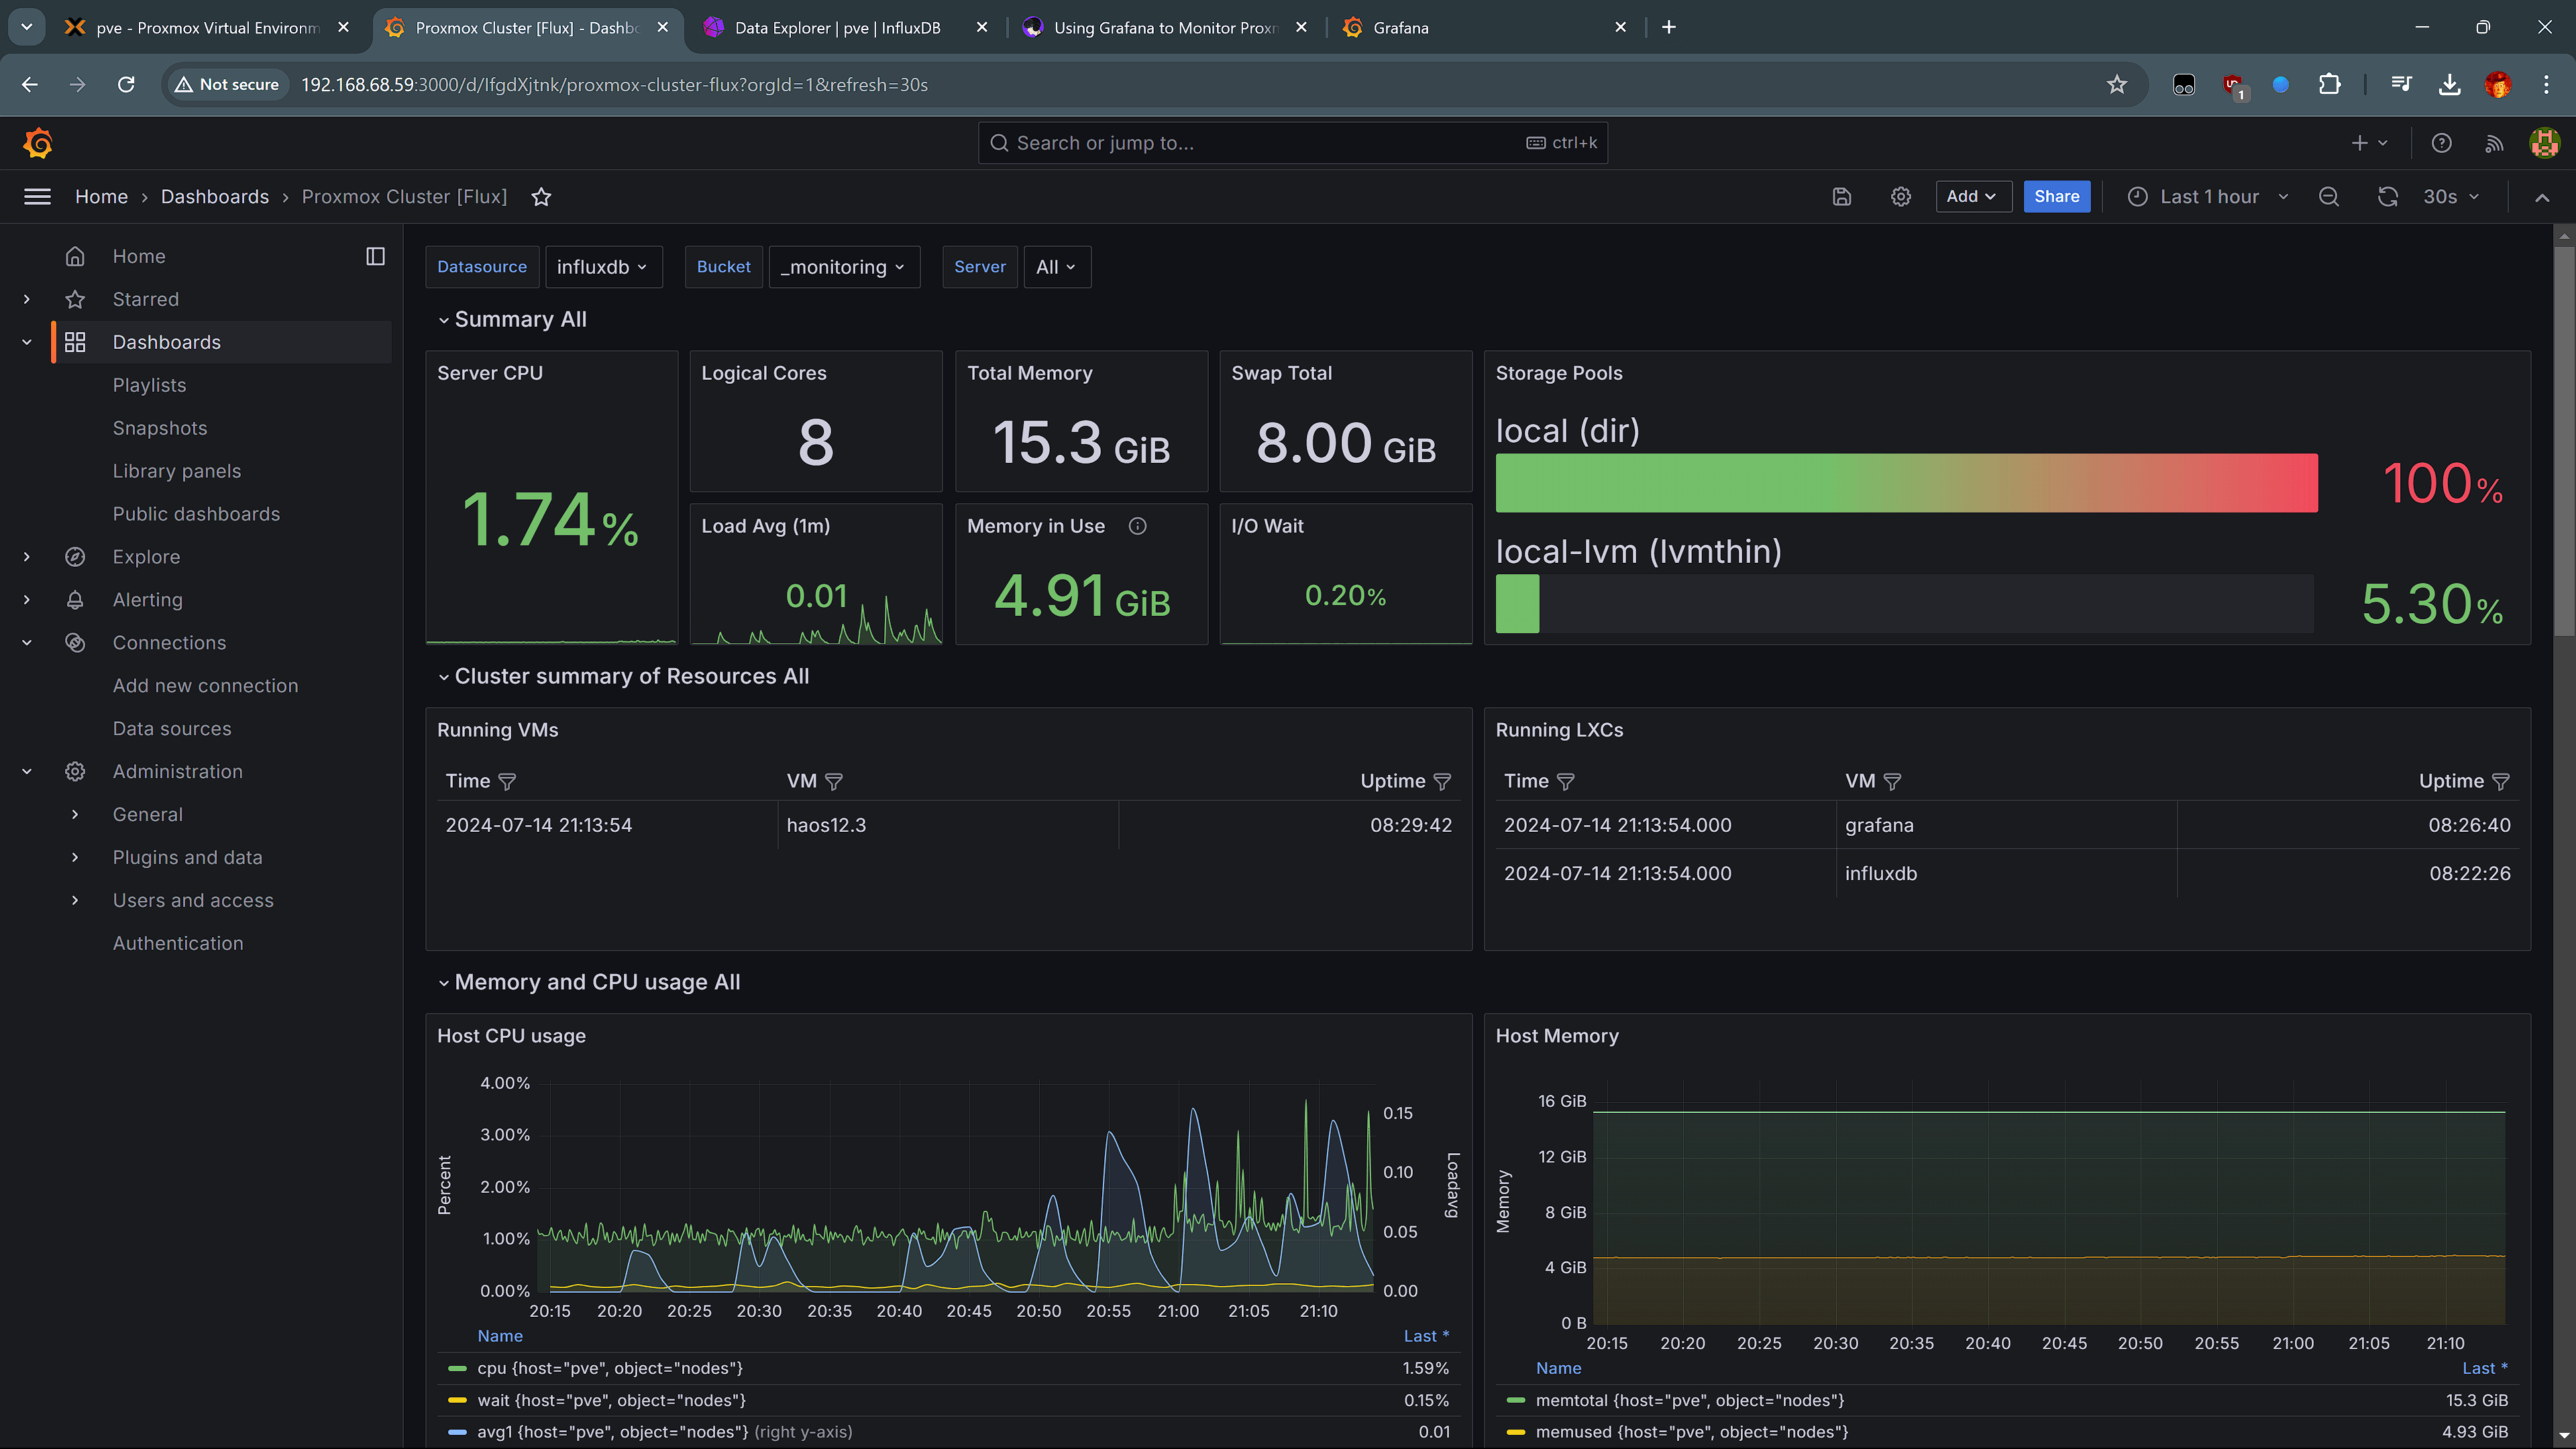
When importing a dashboard, import it normally then make sure to select the correct bucket to select from. As you can see, at the top of my dashboard I am selecting from my InfluxDB data source and the _monitoring bucket.
In the future, I can create new graphs and visualizations easily with Grafana and also set up integrations.
